site site-navbranch.xsl site
Looking for PowerPoint and/or Google Analytics solutions? Please follow the above links to ShufflePoint.com.
section no_callout.xsl no_callout
page static_html.xsl intrasight-misc
Data Visualization Samples
Active Interface's experience with information delivery extends beyond standard business graphics to include industries such as power, transportation, manufacturing, bioinformatics, and meteorology. Below are some sample views from these and other application domains.
Figure 1. Profit loss across banks trading desks.
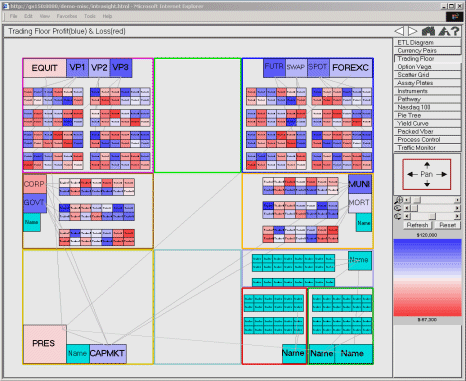
Figure 2. Traditional SCADA diagrams can be built as custom views or converted from existing versions.
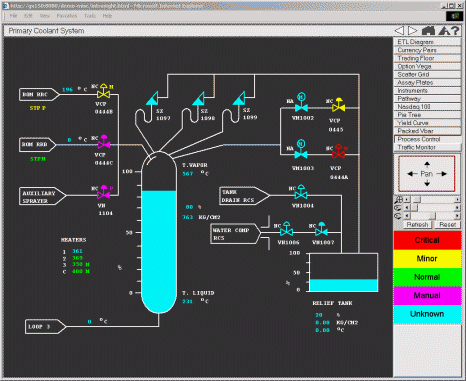
Figure 3. A data transformation process with real-time status and animated flows
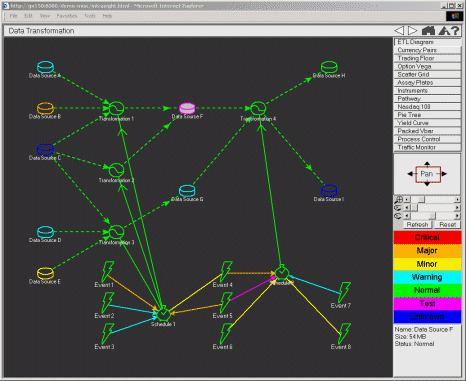
Figure 4. Cross-currency market risk display highlights exceptions quickly.
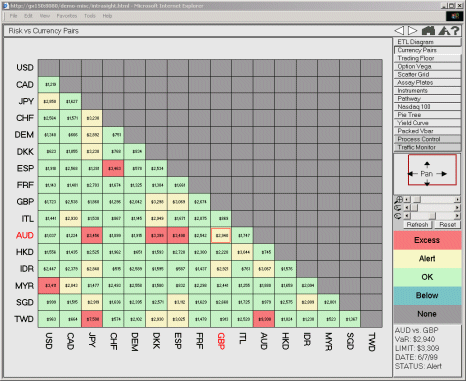
Figure 5. Processing results for a bank of instruments used for high throughput drug screening.
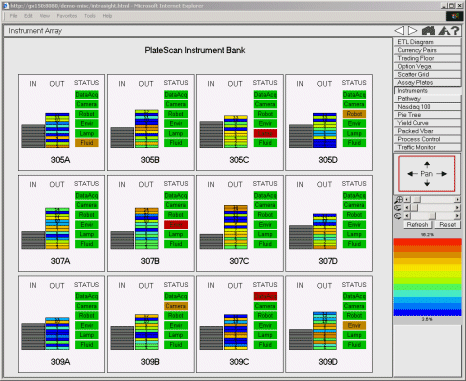
Figure 6. Drill-down onto microtitre plate results.
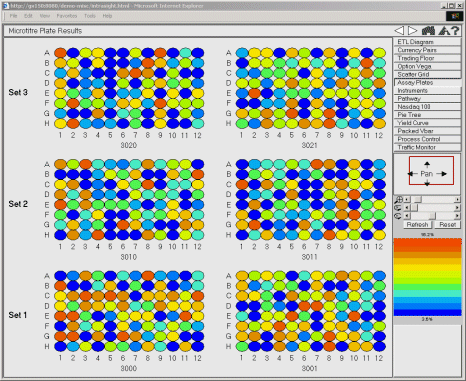
Figure 7. Interactive metabolic pathway displays aid in drug target identification.
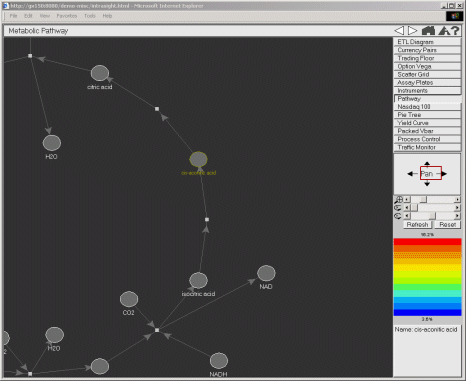
Figure 8. The Nasdaq 100 presented from best to worse on a bad day.
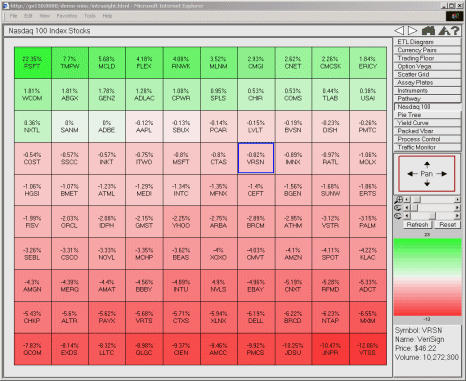
Figure 9. Business performance across the corporate hierarchy.
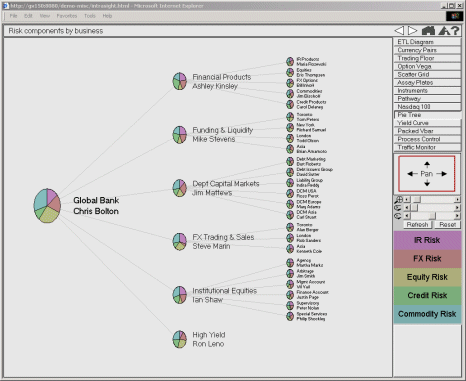
Figure 10. Three-dimensional yield curve.
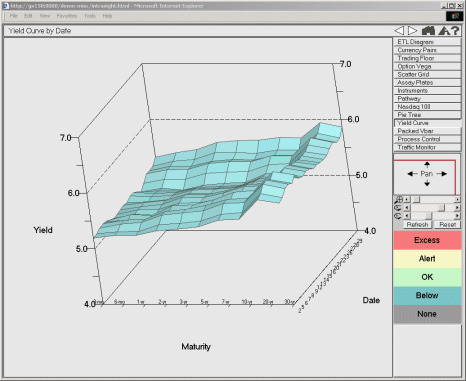
Figure 11. Scatter plot "trellaced" to show relationships in multiple dimensions.

Figure 12. Display personalized live traffic conditions in your dashboard.
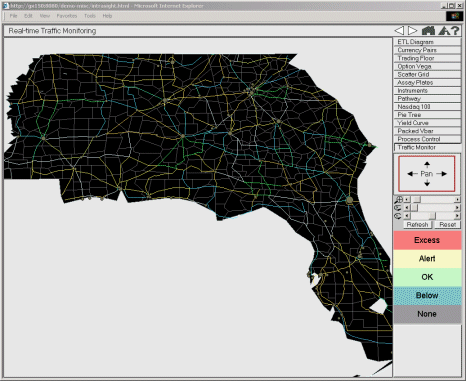
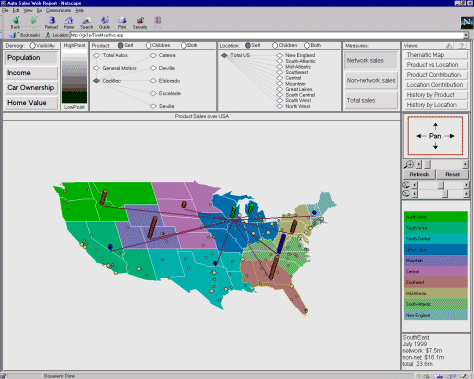
Figure 13. Business Intelligence view showing auto sales by type and location.
