site site-navbranch.xsl site
Looking for PowerPoint and/or Google Analytics solutions? Please follow the above links to ShufflePoint.com.
section no_callout.xsl no_callout
page static_html.xsl b2004_12_2
FLEXpart: Flexible OLAP charting with XMLA and OWC
ChartSpace is the name of the ActiveX charting control which is part of the Office Web Components (OWC) of MS Office. ChartSpace is a very powerful and flexible charting component. And since Office XP, the OWC controls can be used without having a license to Office on the client-side. In the past I have used ChartFX for client-side charting. But with this change of licensing on Microsoft's part, it is harder to justify spending over a thousand dollars to license ChartFX. The samples in this article will be using the Office 2003 version of OWC, which you can download from
At 17 meg, that is one big ActiveX control set. But you can't beat the price - free.
I haven't used ChartSpace in quite some time, and when I had it was probably not to its full capability. In this article I am going to see just how far I can go with using ChartSpace as the graphical presentation tier for an OLAP client.
The ChartSpace control is the Office Web Control used for charting tabular data. I didn't understand the name ChartSpace until I realized that this control provides a canvas or space onto which you can draw one or more charts. You can do really interesting and powerful things and in my opinion it is a shame that Microsoft doesn't better promote the capabilities of this control.
Feeding XML to ChartSpace
One of its less well advertised capabilities is the ability to export the style and data of a ChartSpace instance to XML. This is done by getting the XMLData property from an chart which has been setup. This XML is two directional - if you set the value XMLData, it will recreate the charts appearance (data and styles) based upon the XML you provide. The clever thing then is to use the XML exported via XMLData to create a template for the import. My approach was to create a test harness in VB6 and register the Office Web Controls and then setup the chart as I wanted it to appear in the final application, using both code and property settings. I then added a button whose Click handler gets the XML out and saves it to a file. This file is then turned into an XSLT transformation stylesheet. While I could use the automation script generation approach (ala PowerPoint samples) to turn data into charts, a direct XML approach is always preferable.
The Visual Basic project "project1.vbp" in the zip download is my VB test harness for generating XML from ChartSpace. It has code to populate static data into a chart and code which get data into the chart from the Northwinds database (via an intermediate sheet control).
Using the ChartSpace control in the browser
Visual Basic is not my target platform for ChartSpace - I am targeting Internet Explorer so that I can build a web OLAP portal. The control can be put in a web page using the object tag as follows:
<object id="CSpace" classid="clsid:0002E55D-0000-0000-C000-000000000046" width="100%" height="100%">
	<param name="ScreenUpdating" value="-1">
	<param name="EnableEvents" value="-1">
</object>
The web page sample.htm is a page with nothing but this object. When opened in IE, the Microsoft "Object Web Controls" logo is displayed in the object's screen real estate.
To test that XML can be passed back into the control, I created the page sample2.htm, which has an XMLData parameter with in-line XML. No errors - so far we are good.
One of the limitations of the freely redistributable version of OWC is the limited user interaction support. This control is going to be useless to me if I cannot create interactive portals with it, so I need to determine what level of interaction is allowed. The page sample3.htm adds an event handler for the SelectionChange event of the ChartSpace control. Drum roll please - yes, we get the event! So we are still in the running with this control.
Sample4.htm has an XMLData param which creates a chart in the chartspace control. It sets display properties but doesn't set any data. So far this control works as advertised.
Sample5.htm is a test that the automation API still works with this version of OWC. This test was also successful.
Sample6.htm adds logic to the event handler to check what is the selection type:
	var c = ChartSpace1.constants;
	if (ChartSpace1.SelectionType == c.chSelectionPoint)
		alert("point");
To create an interactive chart, I need to be able to determine what object was selected by the user. With this information, I can affect a drill-down behavior if desired. This file also has, in comments, a list of the different possible values for SelectionType.
For an interactive chart to be truly interactive, I need to be able to change chart properties based upon user interaction. Sample7.htm demonstrates changing a bars color when the bar is clicked by the user. This shows that visual feedback is possible in this control.
Sample8.htm extends this test to see what other object can fire selection events. It also changes selection red and resets the previously selected object to its original color.
Finally, sample9.htm demonstrates that a complete chart definition can be embedded in-line in the XMLData param inside the object declaration.
After these tests I am pretty confident that a cool interactive OLAP portal is achievable using this control. Next, I work on getting some OLAP data into the control.
Loading ChartSpace from the server-side
In a real portal, the XML data for the chart needs to come from the server-side. At this point we hit a N-way fork in the road, for there are may ways to do this.
- we could generate a page with the XMLData inline in the object tag
- we could have script in the page with sets the value of XMLData to a URL which serves up ChartSpace XML
- we could use XML data islands
- we could have the server-side generate some other XML format, and transform it within the browser to the ChartSpace format, and then set the XMLData property to this XML string.
The one and only article I found on using ChartSpaces XMLData property was by Chris Lovett. The link is at the bottom of this article. I've included his sample in the ChrisLovett folder of this articles download. This example, which uses XML and XSL data islands, was a key finding in terms of inspiring me to look further at the ChartSpace control.
I prefer not to use XML data islands because I like to explicitly control the version and lifecycle of the xml objects which I use. The other design decision I am going to make is to send a "tabularized" XML/A result set to the browser. I'll use the same format which I used in the PPT generators. I have three reasons for this approach. First, this transformed result is much smaller than a raw XML/A result. And also it will be easier to write and maintain XSLTs which generate ChartSpace data from this intermediate form. Finally, I already have working code.
The script xmla2table.asp is used to do this intermediate transformation. Rather than read in a static MDX expression, this script borrows a page from SQLXMLs template model. An "analysis" is an MDX template expressed in XSL. The first processing step of xmla2table.asp is to set parameter values (if any) on this MDX template and then run the XSL transform to generate a valid MDX expression. The processor output is stuffed into an XML/A execute template which is then fired off to the XML/A web service. The return value is then transformed using xamd2table.xsl to generate the tabularized result format. And this is returned to the caller.
The tabularized XML is transformed in IE into a presentation view. There are five XSLTs in this project which perform this transformation. One is table.xsl, which generates an HTML table. The others are bar.xsl, column.xsl, line.xsl, and pie.xsl. These four are used to generate XML in the ChartSpace format. These XSLTs where created by using the VB application to generate an XML file, which was used as a template to create an XSLT file.
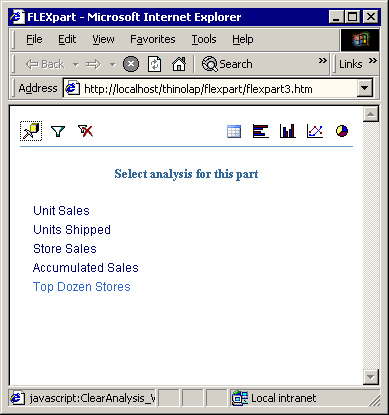
The file flexpart.htm has the client-side logic to orchestrate the user's selection of an analytic to run, the request to xmla2table.asp, and the application of the correct presentation transform. The part initially renders with just the "flexpart" logo. Each flexpart instance has its own menubar, which contains commands for a) selecting an analysis to display, b) displaying a filter dialog, and c) selecting view type.
FLEXpart splash screen

FLEXpart analysis menu

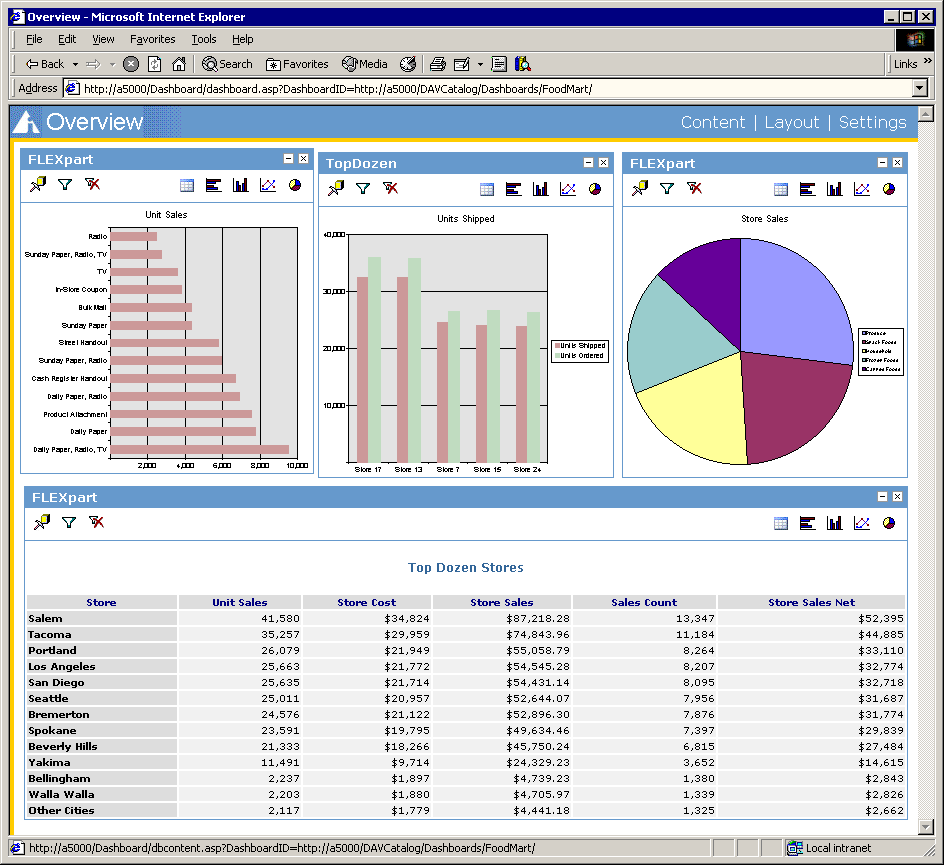
You'll notice that the code has lots of strange syntax with "varPart" and "_WPQ_". These are present because this same code can be placed into a Digital Dashboard (DDRK) DWP file to create an OLAP web part. In the DDRK version, user selections in a part are persisted to the dashboard store. Next time the part is displayed, it restores this saved state. The screenshot below shows several instances of this part in a DDRK dashboard.
FLEXpart web parts in a Dashboard

Summary
I hope that I got across the idea that ChartSpace is one cool XML-aware control. In the next article, I will elaborate on the flexpart concept by adding support for graphical drilldown. And in some future article I'll rewrite this web part for Sharepoint.
downloads: b2004_12_2.zip (60K)
