site site-navbranch.xsl site
Looking for PowerPoint and/or Google Analytics solutions? Please follow the above links to ShufflePoint.com.
section no_callout.xsl no_callout
page static_html.xsl b2005_11_22
Changing xamd.xsl to show KPIs
Changing xmla.wsf to get KPI definitions
I don’t see any way to have my MDX return me the KPI definition information. I’ll ask Mosha but for now I will need to be creative. In order to hand off the xamd.xsl everything it needs, I need to augment the execute result with the discovery result. This should be done in a generic fashion, so I need to change the command-line interface again to support running both.
I’ll accomplish this by allowing both /e and /d to be present in the same invocation. And that required much code rework - mainly in terms of variable declaration and XMLHTTP invocation. Next, I test the script with this new dual interface:
cscript //nologo xmla.wsf /url:"http://localhost/olap/msmdpump.dll" /c:"Adventure Works DW" /e:"SELECT { [Measures].[Total Product Cost], KPIValue('Product Gross Profit Margin'), KPIGoal('Product Gross Profit Margin'), KPIStatus('Product Gross Profit Margin'), KPITrend('Product Gross Profit Margin') } ON COLUMNS, { [Product].[Category].CHILDREN } ON ROWS FROM [Adventure Works]" /d:kpis /r:"catalog=Adventure Works DW,CUBE_NAME=Adventure Works,KPI_NAME=Product Gross Profit Margin" /out:kpi-combined.html /v
Since I have the verbose flag set, the execute and discover XMLA results are saved to xml files so I can verify that I’m getting what I now need to process together. The next thing I did is to change the invocation of the XSLT processor with an addParameter() in the case where both /e and /d where present.
oProcessor.addParameter("rowset",oDiscoverResult.selectSingleNode("//xd:root"));
I copied my existing xamd.xsl to xamd-kpi.xsl and added the param “rowset”. I ran the program to make sure nothing broke. What gets displayed is the same as if I just had the /e part - which is correct since I’ve not yet added any joining logic to the XSLT. That was accomplished by a bit of a hack - I am only going to support having measures on the columns axis - and no crossjoins on columns. This way I can get the UName for the measure of a rendered cell with
<xsl:variable name="cm" select="string(key('Axis', 'Axis0')/xm:Tuples/xm:Tuple[$varColumn]/xm:Member[1]/xm:UName)" />
where $varColumn is the index of the column associated with the cell. Then I can add
<xsl:variable name="sbi" select="$rowset//xr:row[xr:KPI_STATUS=$cm]/xr:KPI_STATUS_GRAPHIC"/>
Which looks up in the kpi rowset the entry with a KPI_STATUS value equal to the measure. For testing at this point, I add
<xsl:attribute name="cm"><xsl:value-of select="$cm"/></xsl:attribute>
<xsl:attribute name="sbi"><xsl:value-of select="$sbi"/></xsl:attribute>
to the TD and invoke the program. A view source shows that I am getting
<td nowrap="true" class="s2" c1="1" cm="[Measures].[Total Product Cost]" sbi="Cylinder"><i>null</i></td>
<td nowrap="true" class="s2" c1="2" cm="[Measures].[Gross Profit Margin]" sbi=""><i>null</i></td>
<td nowrap="true" class="s2" c1="3" cm="[Measures].[Product Gross Profit Margin Goal]" sbi="">0.4</td>
<td nowrap="true" class="s2" c1="4" cm="[Measures].[Product Gross Profit Margin Status]" sbi="Cylinder"><img src="images/Cylinder0.gif"></td>
<td nowrap="true" class="s2" c1="5" cm="[Measures].[Product Gross Profit Margin Trend]" sbi=""><img src="images/Arrow_Status_Asc2.gif"></td>
For some reason my XSL is resulting in the measure [Measures].[Total Product Cost] being treated as a KPI. I am looking at my Xpath and not seeing what is the problem. Is it getting it from the other KPI? Try removing that one. As I suspected, that fixed it. So why is it getting them confused? I added restrictions (which I should have had anyway for efficiency) to only get the relevant KPI. That didn’t fix it but at least I know now it is related to my XPath.
The solution turned out to be putting the string function around the definition of the variable $cm. If anyone can explain why this is necessary, I’d welcome the opportunity better understand the nuances of XSLT/XPATH. Moving on…
Next, I added the variable $tbi which is just like $sbi except that it gets the trend graphic.
So far I haven’t changed the display to use the graphics. After copying the KIP images folder to my work area, I changed the XSL to have
< xsl:when test ="key('Cell', $varStartCell)">
< xsl:choose >
< xsl:when test ="$sbi != ''">
< img src ="images/{$sbi}{key('Cell', $varStartCell)/xm:Value}.gif" />
</ xsl:when >
< xsl:when test ="$tbi != ''">
< img src ="images/{$tbi}{key('Cell', $varStartCell)/xm:Value}.gif" />
</ xsl:when >
< xsl:otherwise >
< xsl:value-of select ="key('Cell', $varStartCell)/xm:FmtValue" />
</ xsl:otherwise >
</ xsl:choose >
</ xsl:when >
The result had a cylinder graphic! But the trend graphic was said to be missing. The page was trying to insert <img src=”images/Status Arrow - Ascending” and no such graphic was present. So the names of the indicators are not the same as the base name of the GIF file. No problem. I added
< enums:indicator >
< item from ="Arrow" to ="Arrow_Beveled"/>
< item from ="Status Arrow - Ascending" to ="Arrow_Status_Asc"/>
< item from ="Status Arrow - Descending" to ="Arrow_Status_Desc"/>
< item from ="Standard Arrow" to ="Arrow_XP"/>
< item from ="Cylinder" to ="Cylinder"/>
< item from ="Gauge - Ascending" to ="Gauge_Asc"/>
< item from ="Gauge - Descending" to ="Gauge_Desc"/>
< item from ="Road Signs" to ="Road"/>
< item from ="Smiley" to ="Smiley"/>
< item from ="Traffic Light" to ="Stoplight_Multiple"/>
< item from ="Shapes" to ="Stoplight_Single"/>
< item from ="Thermometer" to ="Therm"/>
</ enums:indicator >
To my XSLT so as to provide a mapping table. And I changed my image insert to be
<img src="images/{document('')/*/enums:indicator/item[@from=$sbi]/@to}{key('Cell', $varStartCell)/xm:Value}.gif" />
Now all graphics are being inserted.
My MDX had
[Product].[Category].CHILDREN
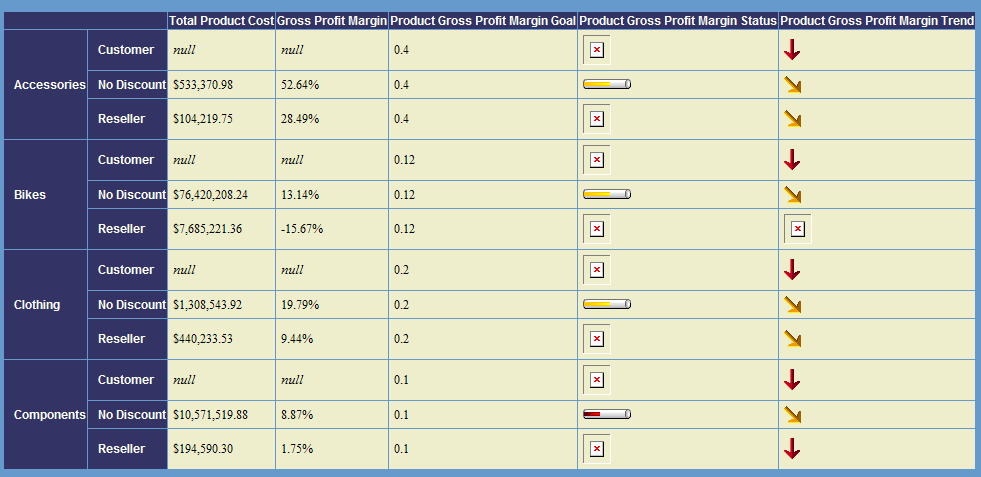
for the rows axis. Serendipitously, I decided to changed it to do a crossjoin. This resulted in the following display.

Notice that a bunch of graphics are missing. Turns out these cells have values of -1, which means my simplistic direct mapping of value to image name is no good. Looking at the definitions of the KPIs in VS.NET, I see that they return values in the domain [-1,0,1]. For Status indicators these must therefore map to file name extensions [1,2,3]. But what about the Trend indicators? Their MDX also has them in the domain of [-1,0,1]. I will assume for now that this should map to image extensions [0,2,4] which means the “half-way” versions (sort of up, sort of down) are not used. Changing the XSL to perform that mapping resulted in the correct graphics.
Shorter KPI labels
The last thing I want to do with this sample is to remove the KPI name part from the Goal, Status, and Trend labels. It is both redundant and it makes the table too wide. This was accomplished by replacing
< xsl:value-of select ="$varMemCapValue" />
with
< xsl:variable name ="varKpi" select ="$rowset//xr:row[xr:KPI_GOAL=$varMemUValue or xr:KPI_STATUS=$varMemUValue or xr:KPI_TREND=$varMemUValue]"/>
< xsl:choose >
< xsl:when test ="$varKpi">
< xsl:value-of select ="substring-after($varMemCapValue,$varKpi/xr:KPI_NAME)" />
</ xsl:when >
< xsl:otherwise >
< xsl:value-of select ="$varMemCapValue" />
</ xsl:otherwise >
</ xsl:choose >
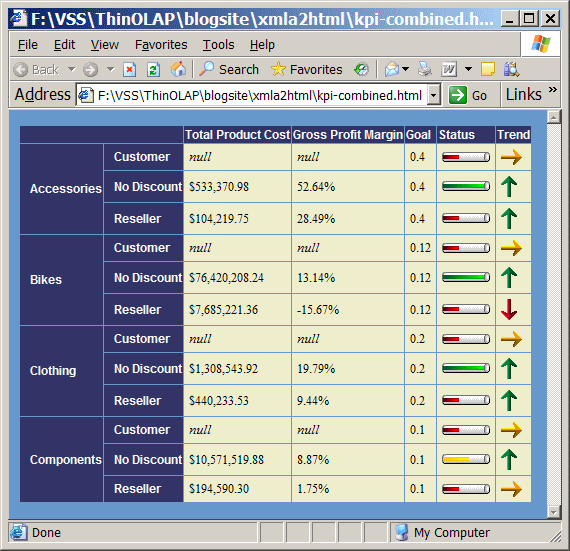
Now I get the following result. I gotta say, that is starting to look pretty slick. And not bad for a couple of hours of work!

downloads: b2005_11_22.zip (55K)
